India Ammonia Market Assessment 2025 by Pricing, Production, Consumption and Trade Analysis
India Ammonia Price Trend Analysis
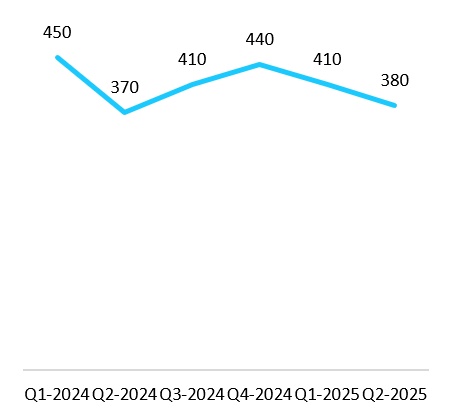
The ammonia price trend in India from Q1 2024 to Q2 2025 began dropping sharply due to oversupplied market conditions, reduced agricultural demand post-harvest, and lower import costs amid stable global supply.
A decline to USD 410 in Q1 2025 reflected lower demand after peak season, surplus inventory, and moderate stability in energy prices.
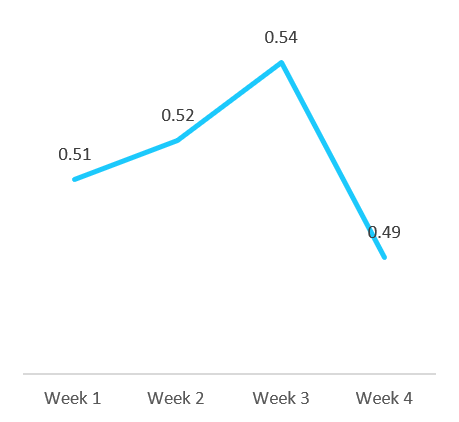
In the fourth week of August 2025, the prices decreased to USD 0.49/ton. This might be due to the Indian rupee’s fluctuations against the USD, impacting import costs. A stronger INR might lower costs, contributing to price stability or a slight decline.
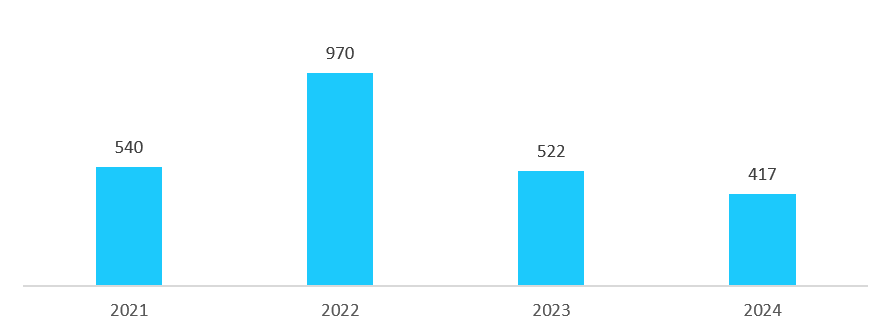
Yearly Price Trend, 2021-2024, USD/Ton
India Quarterly (Quarter I 2024-Quarter II 2025), USD/Ton & Weekly (W1 to W4 of August 2025), USD/Kg, Price Trend
India Consumption Assessment
- India consumes around 19.2 million tons per annum (MTPA) of ammonia to produce fertilizers such as urea, diammonium phosphate (DAP), and other complex fertilisers (OCFs). All the ammonia produced and used in India currently is grey ammonia, derived from reforming natural gas
- At the end of 2024, the Ministry of New & Renewable Energy will increase green ammonia allocation for the fertilizer sector from 0.55 million tons to 0.75 million tons per annum
India Ammonia Production Trend
- Major fertilizer companies, including IFFCO (Indian Farmers Fertiliser Cooperative Limited), rely heavily on ammonia as a precursor for nitrogenous fertilizers. The government’s emphasis on increasing crop yields and ensuring food security has led to schemes like the Fertilizer Subsidy Program, which indirectly boosts demand for ammonia by keeping fertilizer prices affordable for farmers
- Larsen & Toubro is planning to invest USD 550 million by 2030 to establish six green ammonia units at Kandla, Gujarat. These units will aid in reducing CO₂ emissions. The project is expected to unfold in six phases over a decade. L&T aims to export green ammonia to Southeast Asia and Europe, increasing its global presence
India Ammonia Trade & Market Flow Indicator
India Ammonia Import Volume, 2020-2024 (Tons)
| Importers | 2020 | 2021 | 2022 | 2023 | 2024 |
|---|---|---|---|---|---|
|
India |
2437456 |
2437853 |
2235282 |
2336715 |
2394216 |
Frequently Asked Questions (FAQs)
Why we exist:
When “AI-driven averages” lose their meaning, we choose a definite path. Market intelligence is not about scraping the internet or blending numbers. It is about context, accuracy, and judgment. That is why we exist to separate noise from knowledge, and give you insights that mirror the real world.
What drives us:
Every insight starts with rigour. Our analysts bring years of industry experience and apply proven methodologies primary research, expert interviews, and structured secondary validation. Unlike AI, we do not deal in probabilities we deal in realities. Every data point is scrutinised, validated, and cross-checked, because you deserve more than approximations.
How we show up:
Each figure we publish can be traced back to its source, its method, and its logic. Our reports do not “average” the web they represent foundational research built on ground truth. Much of what AI platforms surface originates from firms like ours, stripped of context and simplified. We stand transparent in method, accountable for accuracy, and relentless in setting higher standards for market intelligence.


