India Urea Market Assessment 2025 by Pricing, Production, Consumption and Trade Analysis
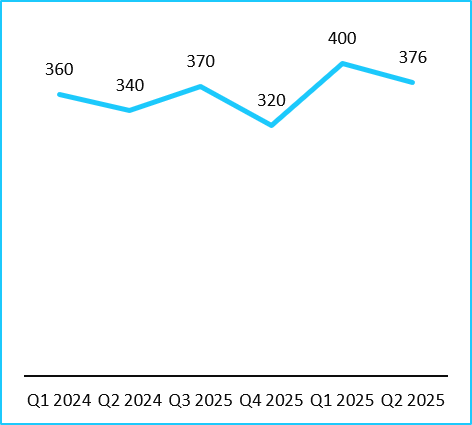
India Urea Price Trend Analysis (from Q1-2024 to Q2-2025)
The price shift of urea in India from Q1-2024 to Q2-2025 illustrates a fluctuating market influenced by domestic and global factors. Prices decreased from USD 360 in Q1-2024 to USD 340 in Q2-2024 due to increased domestic production and reduced import reliance following the revival of urea plants by the Government of India.
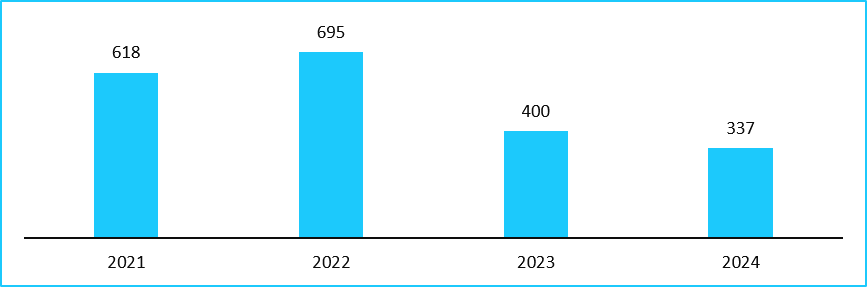
India Urea Yearly Price Trend, 2021-2024, USD/Ton
A dip to USD 320 in Q4-2025 reflects an oversupply or lower demand during off-season periods, while the rise to USD 400 in Q1-2025 could be driven by an increase in agricultural activity and rising input costs like natural gas.
India Quarterly (Quarter I 2024-Quarter II 2025), USD/Ton & Weekly (W1 to W4 of August 2025), USD/Kg, Price Trend
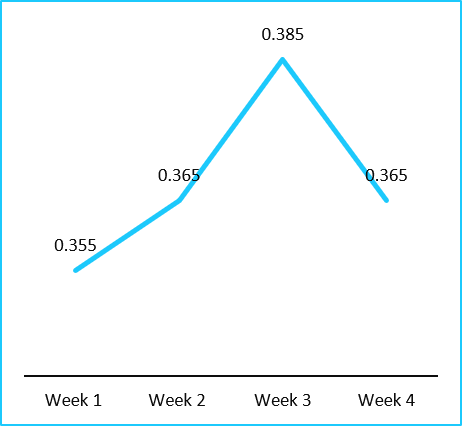
The prices moderately increased in the second and third weeks of August owing to production challenges at key facilities, such as Ma’aden in Saudi Arabia (a major supplier to India), which reduced the import volumes, tightening supply and driving prices higher.
India Urea Consumption Assessment
- India’s Urea Subsidy Scheme (2022-25) was approved with a USD 426.98 million budget by the Cabinet Committee on Economic Affairs (CCEA), which provided USD 62.08 per ton of urea, driving 31 million tons of urea consumption. This affordability sustains its dominance in agriculture.
- India has replaced the consumption of 2.5 million tons of conventional urea with nano urea in FY24. India's urea consumption in the 10 months to February 2024 stood at 31.7 million tons
India Urea Production Trend
- India produces about 25 million tons of urea annually, ranking as one of the top producers globally. The Indian government has been actively working to increase domestic production capacity, which has grown from 22.5 million tons in 2014-15 to 25 million tons in 2023 and around 31 million tons in 2024, with plans to reach 32.5 million tons after commissioning new plants. Furthermore, as per Fertilizer India, urea represents around 79% of nitrogen fertilizers used in India.
India Urea Trade & Market Flow Indicator
India Urea Importing Volume, 2020-2024 (Tons)
| Importers | 2020 | 2021 | 2022 | 2023 | 2024 |
|---|---|---|---|---|---|
| India | NA | NA | NA | 8598258 | 6519840 |
Frequently Asked Questions (FAQs)
Why we exist:
When “AI-driven averages” lose their meaning, we choose a definite path. Market intelligence is not about scraping the internet or blending numbers. It is about context, accuracy, and judgment. That is why we exist to separate noise from knowledge, and give you insights that mirror the real world.
What drives us:
Every insight starts with rigour. Our analysts bring years of industry experience and apply proven methodologies primary research, expert interviews, and structured secondary validation. Unlike AI, we do not deal in probabilities we deal in realities. Every data point is scrutinised, validated, and cross-checked, because you deserve more than approximations.
How we show up:
Each figure we publish can be traced back to its source, its method, and its logic. Our reports do not “average” the web they represent foundational research built on ground truth. Much of what AI platforms surface originates from firms like ours, stripped of context and simplified. We stand transparent in method, accountable for accuracy, and relentless in setting higher standards for market intelligence.


