United States Ammonia Market Assessment 2025 by Pricing, Production, Consumption and Trade Analysis
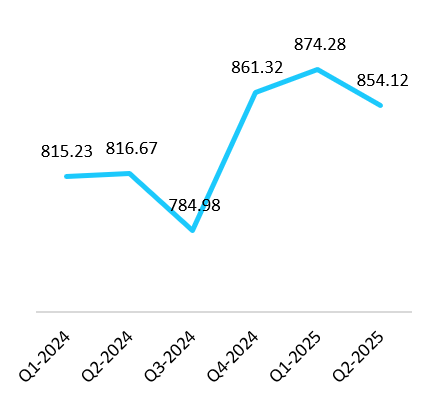
United States Ammonia Price Trend Analysis (from Q1 2024 to Q2 2025)
- The ammonia prices remained relatively stable from Q1 2024 to Q2 2024. A small increase in prices was observed at USD 1.44 per ton, owing to consistent domestic production and moderate demand from the fertilizer sector.
- From Q2 2024 to Q3 2024, the price dropped by approximately 3.88% owing to increased supply or reduced demand. Web sources indicate that in Q2 2024, U.S. ammonia prices were influenced by declining domestic demand and surplus supply. Moreover, the natural gas prices have also seen a decline during the period, further affecting the ammonia price trend.
- Q3 2024 to Q4 2024 saw a significant 9.72% increase, reflecting a supply constraint or rising production costs. Disruptions in Russia’s Kursk region and natural gas shortages in Europe (affecting global supply chains) further impacted U.S. prices. Additionally, rising feedstock costs and geopolitical tensions might have tightened supply, pushing prices up.
- From Q4 2024 to Q1 2025, a small upper shift of 1.50% is observed, possibly due to supply constraints. The U.S. tariff on imports from Trinidad and Tobago may have reduced import availability, supporting higher domestic prices.
- Q1 2025 to Q2 2025: A 2.31% drop indicates a seasonal slowdown in fertilizer demand post-planting or improved supply conditions.
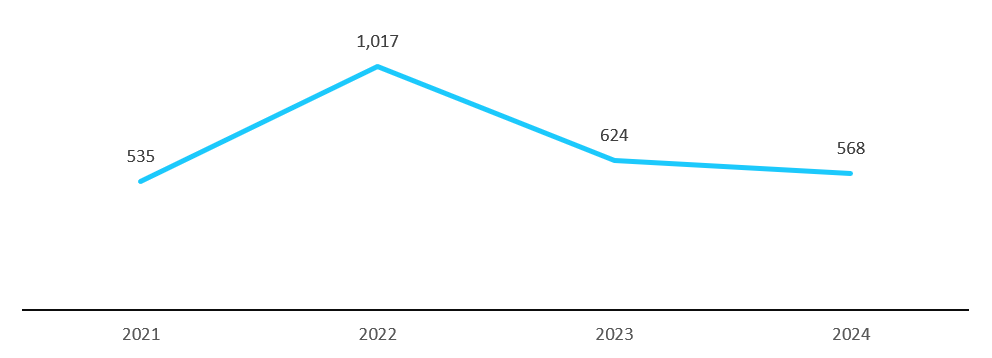
U.S. Yearly Price Trend, 2021-2024, USD/Ton
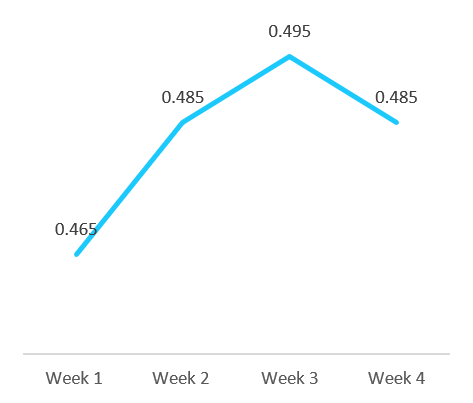
August 2025, Weekly Price Analysis:
- Early August likely saw stable or slightly decreasing prices due to oversupply from high production rates and weak fertilizer demand due to delayed planting (adverse weather in the Midwest).
- Also, the U.S. natural gas prices remained relatively low compared to Europe’s in the first week of August.
- Ammonia prices in the second and third weeks slightly increased owing to maintenance at Gulf Coast facilities (CF Industries), reduced output, and tightening supply.
- Continued Mississippi River barge delays and potential port congestion (e.g., Gulf Coast ports) raised distribution costs, supporting higher prices.
- In the last month, the prices lowered to become stable owing to improved import flows from Trinidad and Tobago, a key U.S. supplier, which balanced the market. Also, end-of-summer agricultural demand tapered off, reducing pressure
U.S. Quarterly (Quarter I 2024- Quarter II 2025), USD/Ton & Weekly (W1 to W4 of August 2025), USD/Kg, Price Trend
United States Consumption Assessment
- The mining sector employs ammonia in explosives manufacturing, as reported by the U.S. Geological Survey (USGS), particularly for ammonium nitrate used in blasting operations
- The DOE also emphasizes ammonia’s growing potential as a clean energy carrier in the country, such as in hydrogen storage, supported by federal initiatives like the Hydrogen Shot program
United States Ammonia Production Trend
- As per the United States Geological Survey (USGS) in 2024, ammonia was produced by 17 companies at 36 plants in 17 States in the U.S. About 60% of total U.S. ammonia production capacity was in Louisiana, Oklahoma, and Texas because of their large reserves of natural gas, the dominant domestic feedstock for ammonia. In 2024, the U.S. plants actively producing ammonia operated at about 90% of rated capacity
- Moreover, as of 2025, 38 proposed ammonia projects across the U.S. could increase annual ammonia production capacity by over 60 million tons per year by 2030. That would result in a near quadrupling of the amount of ammonia production capacity in the U.S. today, from 21 million tons to 81 million tons
United States Ammonia Trade & Market Flow Indicator
U.S. Ammonia Importing Volume, 2020-2024 (Tons)
| Importers | 2020 | 2021 | 2022 | 2023 | 2024 |
|---|---|---|---|---|---|
|
United States of America |
2492838 |
2638814 |
2454036 |
2177607 |
2167283 |
The U.S. and India consistently led as the top importers, reflecting their large agricultural sectors and industrial needs. Total import values peaked in 2022 for most countries, driven by high global ammonia prices and demand surges, followed by a decline in 2023 due to oversupply and falling natural gas prices.
U.S. Ammonia Exporting Volume, 2020-2024 (Tons)
|
Exporters |
2020 |
2021 |
2022 |
2023 |
2024 |
|
United States of America |
506713 |
351598 |
924645 |
1157118 |
1044894 |
Frequently Asked Questions (FAQs)
Why we exist:
When “AI-driven averages” lose their meaning, we choose a definite path. Market intelligence is not about scraping the internet or blending numbers. It is about context, accuracy, and judgment. That is why we exist to separate noise from knowledge, and give you insights that mirror the real world.
What drives us:
Every insight starts with rigour. Our analysts bring years of industry experience and apply proven methodologies primary research, expert interviews, and structured secondary validation. Unlike AI, we do not deal in probabilities we deal in realities. Every data point is scrutinised, validated, and cross-checked, because you deserve more than approximations.
How we show up:
Each figure we publish can be traced back to its source, its method, and its logic. Our reports do not “average” the web they represent foundational research built on ground truth. Much of what AI platforms surface originates from firms like ours, stripped of context and simplified. We stand transparent in method, accountable for accuracy, and relentless in setting higher standards for market intelligence.


