United States Urea Market Assessment 2025 by Pricing, Production, Consumption and Trade Analysis
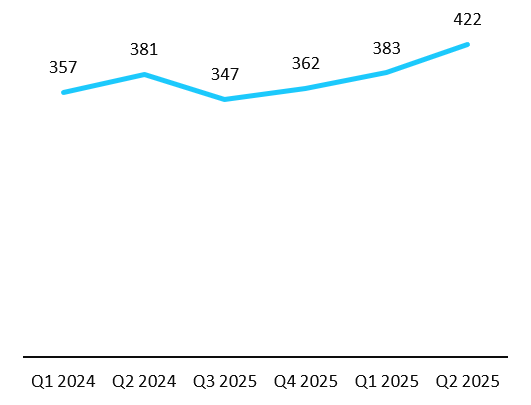
U.S. Urea Price Trend Analysis (From Q1 2024 to Q2 2025)
- The price shift of urea in the U.S. from Q1-2024 to Q2-2025 reflects agricultural demand and energy market influences. Prices rose from USD 357 in Q1-2024 to USD 381 in Q2-2024 due to increased planting season demand and rising natural gas costs, a key production input.
- A dip to USD 347 in Q3-2025 may be attributed to a post-harvest urea surplus reducing fertilizer needs, while a recovery to USD 422 in Q2-2025 suggests demand from spring planting and higher energy prices.
- The overall upward trend could also be influenced by supply chain disruptions and reliance on imports, with U.S. production capacity struggling to meet the annual demand of approximately 16 million tons.
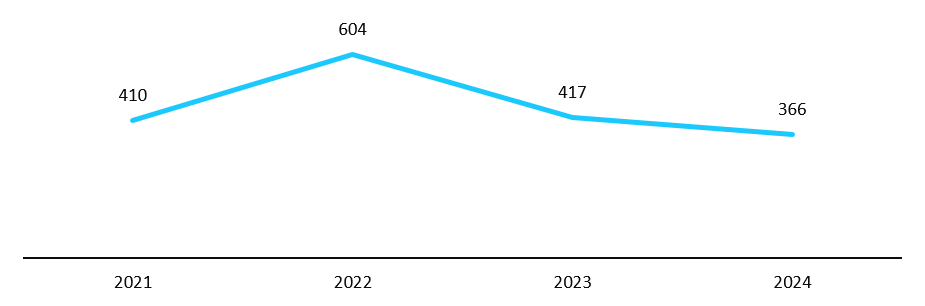
U.S. Yearly Price Trend, 2021-2024, USD/Ton
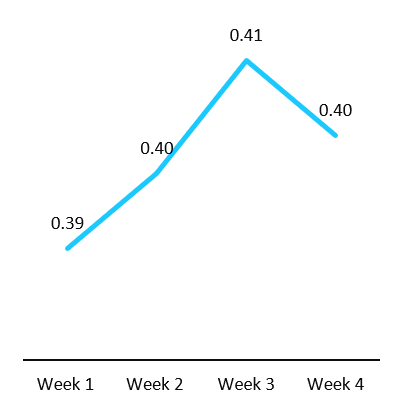
August 2025, Weekly Price Analysis
- Early August likely saw stable or slightly decreasing prices due to oversupply from high production rates and weak fertilizer demand due to delayed planting (adverse weather in the Midwest).
- Urea prices in the second and third weeks slightly increased owing to maintenance at Gulf Coast facilities (CF Industries), reduced output, and tightening supply.
- Continued Mississippi River barge delays and potential port congestion (e.g., Gulf Coast ports) raised distribution costs, supporting higher prices.
- In the last week, the prices lowered to become stable owing to improved import flows from Trinidad and Tobago, a key U.S. supplier, which balanced the market. Also, end-of-summer agricultural demand tapered off, reducing pressure.
U.S. Quarterly (Quarter I 2024-Quarter II 2025), USD/Ton & Weekly (W1 to W4 of August 2025), USD/Kg, Price Trend
U.S. Urea Consumption Assessment
- The urea market in the U.S. is primarily driven by its agricultural, food, and related sectors, contributing 5.5 percent to the country’s GDP in 2024.
- Furthermore, the U.S. is one of the largest fertilizer-producing countries, producing around 53 million tons of fertilizer in 2024-25
U.S. Urea Production Trend
- Natural gas-based plants are the main source of Urea production in the U.S., accounting for approximately 92% of the country’s Urea production
- In North America, the use of urea in agriculture is largely facilitated by the unrestricted access to natural gas, which is essential for the Haber-Bosch process. Agriculture is a significant sector in North America, with its main crops including grains, fruits, vegetables, legumes, and plants used for non-food purposes.
- From 2000 to 2024, North America's domestic natural gas production grew by 69%. The region now produces 22% of the world's natural gas.
U.S. Urea Trade & Market Flow Indicator
U.S. Urea Importing Volume, 2020-2024 (Tons)
| Importers | 2020 | 2021 | 2022 | 2023 | 2024 |
|---|---|---|---|---|---|
|
United States of America |
4564455 |
6268170 |
5342212 |
4811668 |
5097863 |
Frequently Asked Questions (FAQs)
Why we exist:
When “AI-driven averages” lose their meaning, we choose a definite path. Market intelligence is not about scraping the internet or blending numbers. It is about context, accuracy, and judgment. That is why we exist to separate noise from knowledge, and give you insights that mirror the real world.
What drives us:
Every insight starts with rigour. Our analysts bring years of industry experience and apply proven methodologies primary research, expert interviews, and structured secondary validation. Unlike AI, we do not deal in probabilities we deal in realities. Every data point is scrutinised, validated, and cross-checked, because you deserve more than approximations.
How we show up:
Each figure we publish can be traced back to its source, its method, and its logic. Our reports do not “average” the web they represent foundational research built on ground truth. Much of what AI platforms surface originates from firms like ours, stripped of context and simplified. We stand transparent in method, accountable for accuracy, and relentless in setting higher standards for market intelligence.


